Challenge
Mobile LiDAR-based sensors (e.g., laser scanners) enable area-wide acquisition of 3D data. Large-scale 3D terrain models built from these data can act as a basis to support different tasks, reaching from the visualization of operational areas to situational awareness by generation and analysis of a common operating picture. The latter task requires georeferencing of all available information and storing of all data in a common global database, making it usable for simulations and planning. However, direct usage of the 3D data is hampered by the huge amount of data points acquired within even short time intervals. As an example, one hour of data acquisition by the laser scanners on IOSB's MODISSA typically results in more than 10 billion georeferenced 3D points. The handling of such amounts of 3D data can't be done straightforward, it requires an adequate and efficient data structure.
Solution concepts
The established way to organize, store and access big collections of data is the usage of databases and database-management systems (DBMS). Besides only storing the data in the database, the DBMS allows updating and querying the data based on selected attributes. In addition, spatial databases or geo-databases include and allow queries based on multi-dimensional attributes. The geo-coordinates are the most prominent attribute for such multi-dimensional queries. Using a spatial database, large amounts of 3D indexed data can be stored and properly handled, meaning that 3D queries can be dealt with quickly and efficiently.
Following a conceptual design of a system for efficient 3D data handling based on geo-databases and a comparison of different alternatives, we implemented such a system based on PostgreSQL and PostGIS. In addition to 3D sensor data, all other georeferenced data can be included into the database as well, e.g., images with metadata.
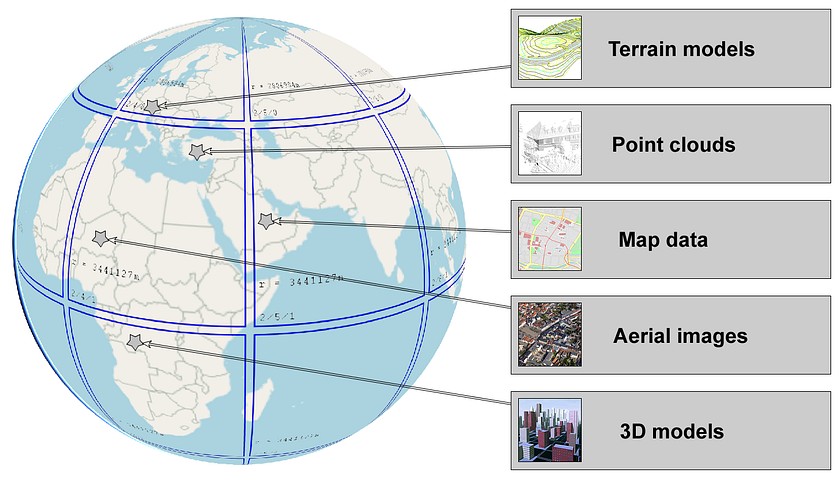
Fig. 1: OSG-Earth can be used to visualize different data types with geographical reference.
In order to visualize the contents of the geo-database, OSG-Earth was connected to its infrastructure. OSG-Earth is an open-source C++ geospatial SDK and terrain engine. It is based on the OpenSceneGraph project, which is an open-source 3D graphics API that provides and uses flexible scene graphs for the representation of 3D scenes. The basis of all visualizations is a virtual globe that is used to navigate through the data (see Figure 1). OSG-Earth offers visualization components for standard formats like map data or terrain models. On top of that, own visualization components can be developed and integrated if needed.
Additional alternatives are considered for the visualization of large 3D point clouds. For example, the open-source point cloud renderer Potree uses a hierarchical data structure in order to visualize point clouds containing billions of 3D points in real-time in a web browser (see Figure 2). Innovative concepts like these are developed further and applied within own visualization solutions.
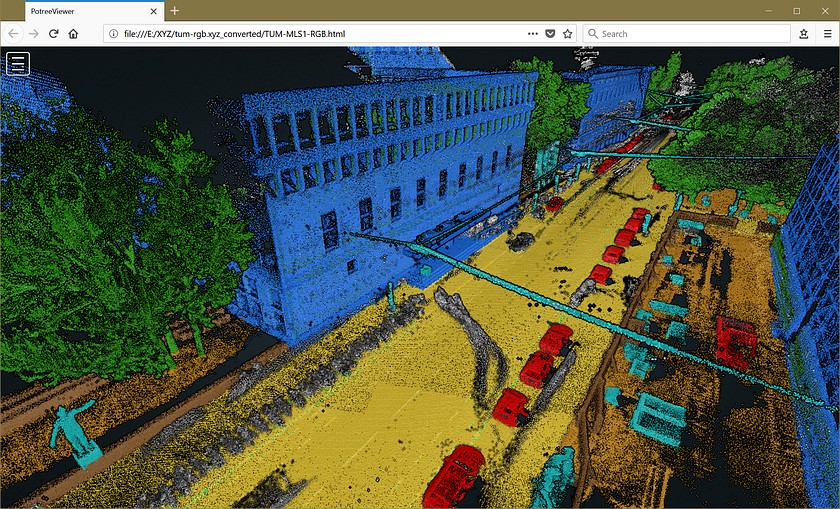
Fig. 2: Visualization of the labeled part of the "TUM-MLS-2016" data set (195 million points) in a web browser using Potree.