Airborne laser scanning - test data: Abenberg (2008, 2009)
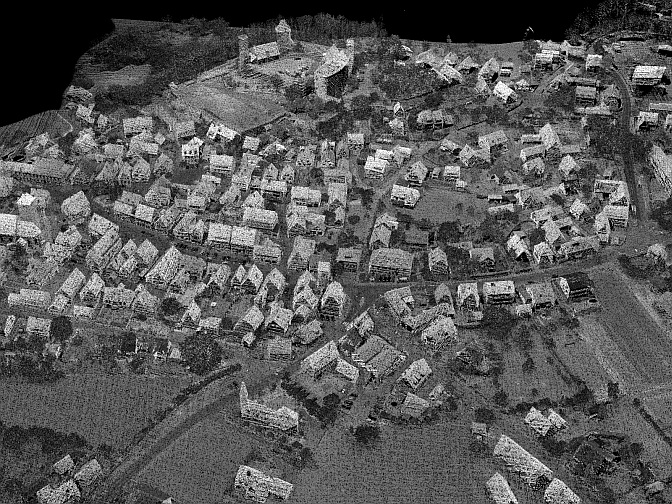
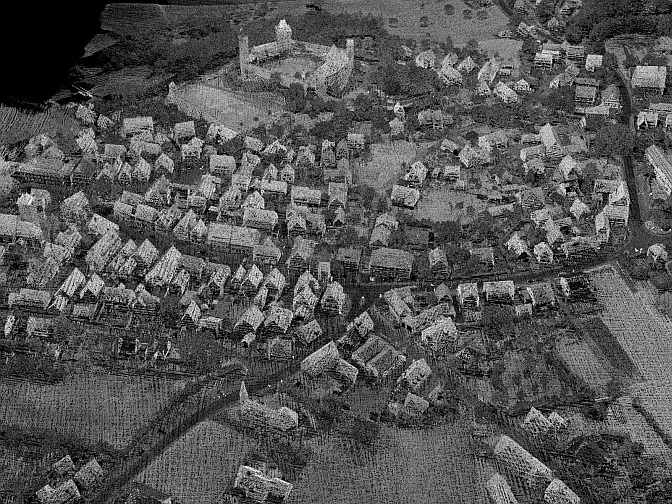
In April 2008, the test site Abenberg (49.2416° N, 10.9636° E) was covered by four ALS strips in a cross pattern, resulting in an accumulated point cloud which includes 5,400,000 points with an average point density of 16 pts/m². The first figure shows a rendered visualization of these data, where each point is gray-value coded according to the echo amplitude, which is derived from full waveform analysis of the backscattered pulse. The test site was scanned again in August 2009, using the same sensors and a similar setting (second figure). In addition to the coordinates of 3D points, the data sets contain the sensor positions, local normal directions and results of pre-classification. These multi-temporal multi-view ALS data are well suited for the development and evaluation of change detection methods, and for the investigation of other applications of ALS data, e.g., city modeling.
The data are commonly available for algorithm development, testing and evaluation. Details of the data format are explained in an included readme file. When using the data in any publication, please cite the original paper:
Hebel, M., Arens, M., Stilla, U., 2013. Change detection in urban areas by object-based analysis and on-the-fly comparison of multi-view ALS data. ISPRS Journal of Photogrammetry and Remote Sensing 86, pp. 52-64. [DOI: 10.1016/j.isprsjprs.2013.09.005] [PDF]
Download: Abenberg data 2008 [111 MB]
Download: Abenberg data 2009 [147 MB]